

90.4% of Active Systems Reach End-of-Life Support, with 14.1% Operating at Critical Risk Levels from Overlapping Aging, Complexity, and EOL
90.4% of Active Systems Reach End-of-Life Support, with 14.1% Operating at Critical Risk Levels from Overlapping Aging, Complexity, and EOL
SHIFT Analyzes 314 Million Lines of Code Across 213 Systems to Uncover Hidden Risks and Perception Gaps in Japanese Enterprise Systems
SHIFT Inc. (“SHIFT,” headquartered in Minato-ku, Tokyo, Japan; Masaru Tange, CEO and Representative Director), a provider of business transformation services rooted in quality, has conducted a risk survey targeting 213 systems operated by 144 companies and organizations in Japan.
Traditionally, risk surveys targeting active systems in Japanese enterprises relied heavily on questionnaires filled out by system operators and executives. While these surveys strongly reflected corporate awareness and perceived challenges, they had limitations in objectively capturing the internal realities of the systems. In this study, with the consent of the operating entities, SHIFT analyzed 314 million lines of code across the target systems using static analysis and LLM (Large Language Model) analysis, uncovering the actual state of operational risks that were previously hidden.
[Key Findings]
– System failure risks surge after 20 years of operation, with deterioration progressing in two distinct stages.
– 90.4% of operational systems have reached End-of-Life (EOL) support. Furthermore, 14.1% fall into the critical-risk category, suffering from a toxic combination of aging, high complexity, and EOL.
– A significant perception gap exists regarding system scale, with cases where the actual number of screens was nearly 10 times higher than assumed.
[Detailed Findings]
■ System Failure Risk Surges After 20 Years of Operation; Deterioration Follows a Two-Stage Model
Cyclomatic Complexity Number (CCN) is a key metric used to evaluate system complexity, representing program conditional branching and structural intricacy. Higher CCN values make code reading and modification increasingly difficult, exponentially raising the likelihood of issues and system failures. Therefore, CCN was positioned as one of the primary indicators in this analysis.
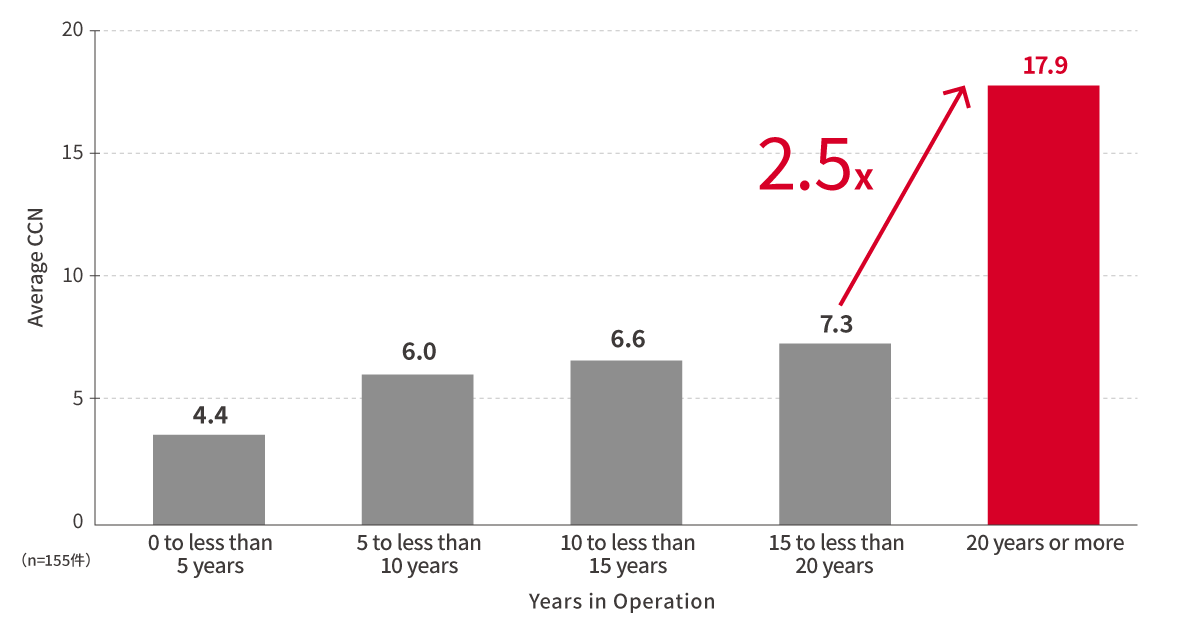
Under standard benchmarks, a CCN of 10 or below indicates low complexity and ease of modification/testing, whereas a CCN exceeding 11 is categorized as moderate complexity, carrying higher risk. Aggregating average CCN values across 155 systems with verifiable operational lifespans revealed that while systems operating for 15 to under 20 years stayed at an average CCN of 7.3, systems operating for 20 years or longer saw their average CCN jump approximately 2.5 times to 17.9.
Furthermore, analyzing other key metrics—such as quality scores, the number of high-risk vulnerabilities, and End-of-Life (EOL) reach rates—confirmed that degradation manifests at different stages depending on the metric. Crucially, system deterioration does not progress linearly but follows a “Two-Stage Deterioration Model.” During the first 10 years of operation, a decline in quality scores occurs first, followed later by the overt accumulation of complexity and technical debt.
Based on these results, enterprises should proactively update design documentation and operational manuals after 10 years of operation to prepare for future modifications. For systems operating for 20 years or more, conducting actual CCN measurements to assess risk becomes vital for planned system health management.
■90.4% of Active Systems Reach EOL; 14.1% Face Critical Risk from Overlapping “Aging, Complexity, and EOL”
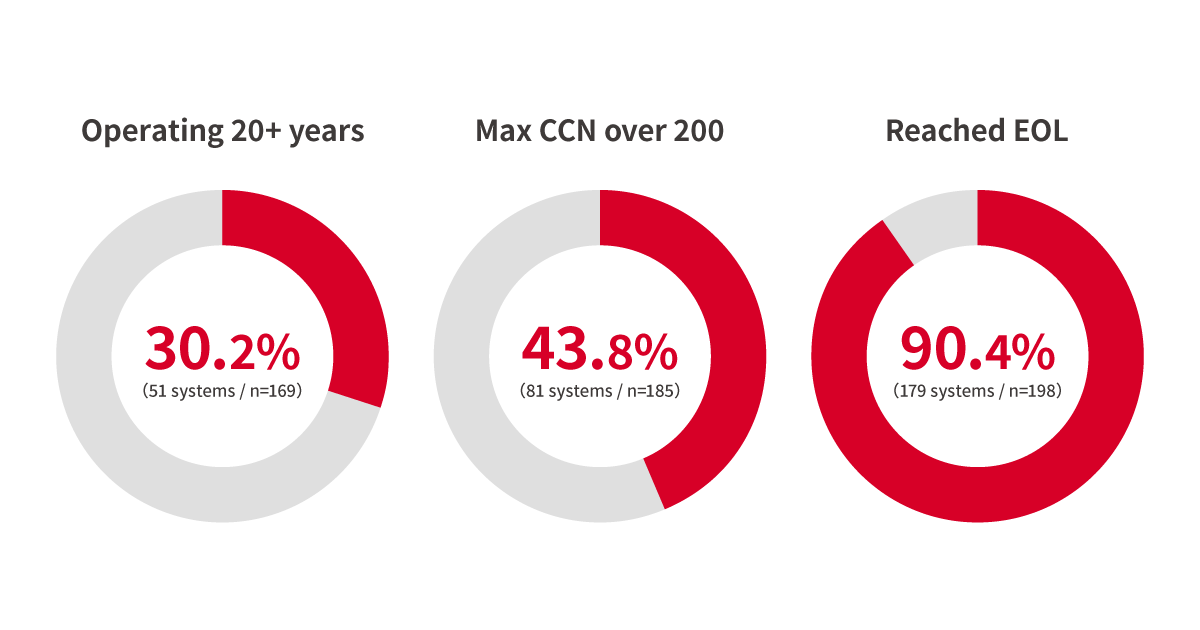
SHIFT investigated the reality of three metrics directly linked to legacy risks: Operating for 20+ years (Aging), Max CCN exceeding 200 (Complexity; over 4x the critical risk threshold), and Reaching EOL (End-of-Support). The metrics were compiled across verifiable systems (169 systems for 20+ years operation, 185 for Max CCN >200, and 198 for EOL status).
The analysis showed that 30.2% of systems had been running for 20+ years, 43.8% had a maximum CCN exceeding 200, and 90.4% had reached EOL (end of vendor support). With EOL reach exceeding 90%, technical infrastructure obsolescence has become severe across most systems. The majority of surveyed systems suffered from at least one of these issues—long-term operation, code complexity, or obsolete technology bases—highlighting widespread legacy risks.
Moreover, 14.1% of systems met all three negative conditions, qualifying as “Critical-Risk Systems.” Notably, 100% of systems that were both 20+ years old and had a Max CCN >200 had already reached EOL.
Systems meeting all three conditions exist in an extremely precarious state where fatal risks converge simultaneously: design intent becoming a black box due to missing original personnel, inability to determine the impact scope during modifications, and security vulnerabilities caused by the lack of vendor patches. Companies with systems meeting all three criteria have reached the stage where modernization must be earnestly considered. Even if a system does not meet all three, matching even one criterion warrants a planned review.
■Perception Gaps in System Scale: Actual Screen Counts Found Up to 10 Times Higher Than Expected
Screen count is a crucial metric when estimating the effort and cost required for system migration. In this source code analysis, the actual number of screens identified significantly exceeded original corporate estimates.
For instance, in “System B”—which the operating company had recognized as a “relatively large system”—the analysis revealed approximately 3,000 actual screens, nearly 10 times the initial assumption of around 300 screens. This system lacked mechanisms to standardize common screen processing, leading to individual branching and proliferation of logic. Consequently, its maximum CCN exceeded 500 (over 10 times the dangerous threshold), creating localized pockets of extreme complexity. In this study, systems with 3,000+ screens represented the top 2% of the total dataset, proving to be among the largest systems analyzed.
Such substantial perception gaps regarding functional and system scale directly cause underestimated cost estimates, schedule delays, and misjudgments of impact scope during migration. Proceeding with modernization plans without grasping system scale based on precise measurement data poses significant project risks.
[Survey Overview]
– Survey Title: “Hidden Risks” in Japanese Enterprise Systems: 2026 Report
– Survey Period: September 2025 – August 2026
– Methodology: Analysis of target system source code combining static analysis engines and AI
– Target Scope: 213 systems across 144 companies/organizations (Total source code lines: 314 million lines of code)
– Conducting Entity: SHIFT Inc.
*Note: When citing or referencing these survey results, please explicitly state the source as “SHIFT Inc.: ‘Hidden Risks’ in Japanese Enterprise Systems Survey 2026.”.
[About the Preliminary Summary Report]
The preliminary summary report of this survey includes additional findings such as:
– The reality of localized risks hidden behind “average quality metrics”
– The actual impact level of legacy technologies
– Multi-layered risks lurking in small-scale systems
– A “Primary Evaluation Method” to measure aging risks in your own systems
– Key metrics to prioritize when selecting systems for modernization
The report also includes a “Type-based Risk Diagnosis” derived from the findings and a “Benchmark Worksheet” at the appendix to easily check your company’s system risk status. We encourage you to utilize it as a first step toward understanding the current state of your enterprise systems.
URL: https://contents.shiftinc.jp/modernization/download/
[About SHIFT’s “AI Modernization”]
SHIFT’s AI Modernization service combines “SHIFT DQS (Development Quality Standard)”—a proprietary framework driving high-quality software development—with AI technology. By supporting system visualization, strategy formulation, development, and operation/maintenance, it enhances the asset value of existing systems while improving productivity and value creation in new development.
SHIFT DQS for Reverse Engineering
Visualizes internal and external specifications from source code to generate up to 46 document types. The core AI analysis technology is co-developed and precision-validated with Matsuo Institute, Inc.
SHIFT DQS for Strategy
Analyzes As-Is and To-Be states using visualized data to establish an optimal phased roadmap for system modernization.
SHIFT DQS for Forward Engineering
Utilizes AI and SHIFT DQS to deliver high-quality, cost-effective system development.
SHIFT DQS for Maintenance Support
Leverages AI to automate and streamline system operations and maintenance. Builds next-generation SRE frameworks focused on standardization and automation, including automated document updates during system modifications.
Dedicated Site: https://contents.shiftinc.jp/modernization/
Inquiries regarding AI Modernization: https://contents.shiftinc.jp/modernization/#contact